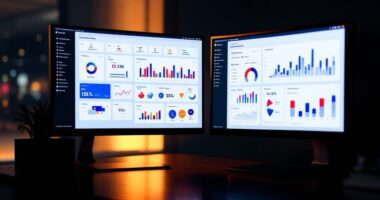
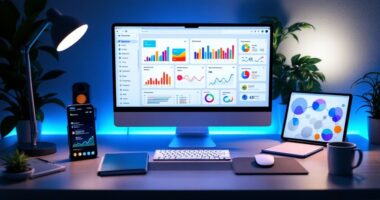
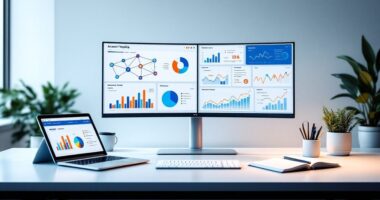
Stock market analysis software combines real-time data, technical indicators, and fundamental analysis tools to help investors make informed decisions. Popular platforms like WallStreetZen, TradingView, and Morningstar offer features ranging from basic charting to advanced AI-driven pattern recognition. These tools typically include customizable dashboards, live market feeds, and backtesting capabilities. Monthly subscriptions range from $20 to $200, with options for both beginners and professionals. Exploring these platforms reveals increasingly sophisticated ways to analyze market opportunities.
Quick Overview
- Stock analysis software combines real-time market data, technical indicators, and fundamental analysis to help investors make informed trading decisions.
- Popular platforms like WallStreetZen, TradingView, and Morningstar offer specialized tools for different investment strategies and experience levels.
- Advanced charting capabilities include customizable views, over 400 technical indicators, and real-time scanning for potential trading opportunities.
- Pricing options range from free basic features to premium subscriptions between $20-$200 monthly, catering to different trader needs.
- Automated features and backtesting environments help reduce emotional decision-making and enable strategy testing using historical market data.
Understanding Stock Analysis Software Essentials

Stock analysis software serves as the cornerstone of modern investment decision-making, providing investors with powerful tools to evaluate market trends and opportunities. These platforms combine essential features like real-time market data, technical indicators, and fundamental analysis capabilities to help users make informed investment choices. Automated investing capabilities reduce emotional decision-making when executing trades.
The core components of stock analysis software include:
- User-friendly dashboards for easy navigation
- Thorough charting tools with multiple timeframes
- Integration with various data sources
- Technical and fundamental analysis capabilities
- Customizable screening tools
Users can perform different types of analysis:
- Fundamental evaluation of company financials
- Technical analysis of price patterns
- Quantitative modeling using statistics
- Sentiment tracking through news and social media
- Industry comparisons and peer analysis
The software simplifies complex market data, making it accessible for both novice and experienced investors.
Top Platforms for Market Research and Trading
While traversing the vast landscape of investment tools, investors can choose from several leading platforms that offer distinctive features for market research and trading.
Today’s top platforms combine sophisticated analysis capabilities with user-friendly interfaces, catering to both novice and experienced investors. Investors using these tools can potentially achieve returns exceeding market averages.
Key market leaders stand out with their specialized offerings:
- WallStreetZen dominates fundamental analysis with aggregated financial data and analyst performance tracking.
- TradingView serves 90+ million users with advanced charting tools and a vibrant community of traders.
- Morningstar excels in mutual fund and ETF analysis, providing independent research and ratings.
- TrendSpider leverages AI for pattern recognition and strategy development, integrating multiple data types.
These platforms represent the evolution of stock analysis software, offering increasingly sophisticated tools while maintaining accessibility for various investor types.
Key Features That Drive Investment Decisions
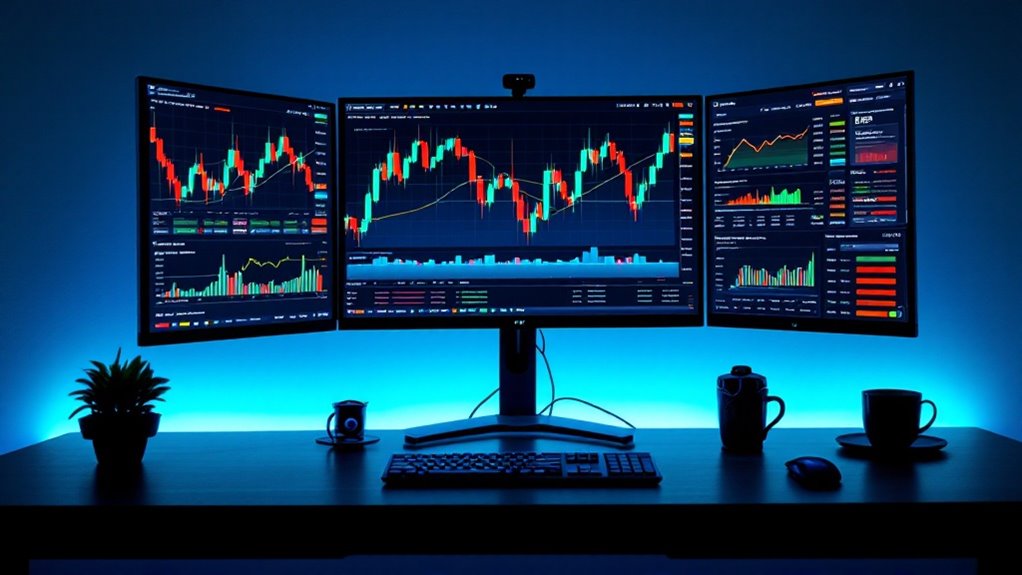
Modern investment decisions rely heavily on sophisticated software features that transform raw market data into actionable insights. Key features driving these decisions include real-time market updates, advanced charting tools, and extensive analysis capabilities.
Real-time data streams provide investors with instant access to price movements, volume changes, and breaking news. Advanced charting tools offer customizable views with multiple timeframes and technical indicators, helping users identify potential trading opportunities. The platform integrates with verified brokers for direct trading execution from charts.
Meanwhile, robust analytical features combine both technical and fundamental approaches:
- Live streaming quotes and instant alerts
- Customizable charts with drawing tools
- Technical indicators and pattern recognition
- Company financials and earnings reports
- Backtesting capabilities for strategy validation
These integrated tools enable investors to make well-informed decisions based on thorough market analysis and tested strategies.
Comparing Pricing Models and Value Propositions
Selecting the right investment software requires careful evaluation of both pricing structures and the specific value offered to different types of traders.
Today’s market offers multiple pricing models that cater to diverse trading needs and budgets. Companies are increasingly focused on efficient growth, balancing revenue expansion with profitability rather than pursuing growth at any cost.
- Subscription-based plans provide predictable costs, with monthly fees ranging from $20 to $200 and annual discounts of up to 20%.
- Pay-per-use structures allow traders to scale costs based on actual platform usage, ideal for occasional traders.
- Freemium models offer basic features at no cost, with premium upgrades available for advanced tools and real-time data.
- Value propositions vary greatly between professional and retail investors, with professionals receiving advanced analytics and automated trading capabilities, while retail investors benefit from user-friendly interfaces and educational resources.
The choice between these models depends on trading frequency, technical needs, and budget constraints.
Choosing the Right Platform for Your Trading Style
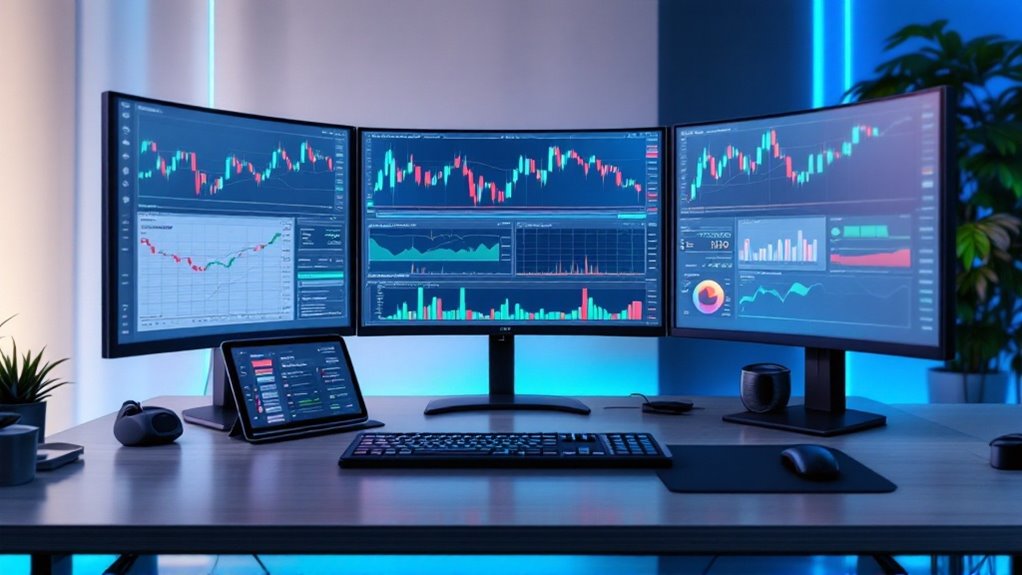
Building on the understanding of pricing models, traders must align their choice of analysis software with their specific trading approach and requirements.
Different trading styles demand distinct platform features and capabilities to optimize performance and decision-making.
Trading success hinges on matching your platform’s features to your unique trading style and strategic requirements.
Day traders need platforms with real-time data feeds and rapid execution capabilities, while swing traders benefit more from robust charting tools and pattern recognition features. Software platforms with zero commission fees have become increasingly popular among traders of all experience levels.
Long-term investors should prioritize platforms with extensive fundamental analysis tools and research resources. For automated trading strategies, API access and backtesting capabilities become essential considerations.
The ideal platform should match the trader’s technical proficiency and workflow preferences.
Key factors include:
- User interface intuitiveness
- Mobile accessibility
- Data coverage breadth
- Educational resources
- Automation capabilities
Advanced Tools and Technical Capabilities
Successful traders rely heavily on sophisticated analytical tools that form the backbone of their decision-making process.
Modern stock market analysis software offers extensive features that transform raw market data into actionable insights. These platforms provide essential capabilities for both novice and experienced traders. Advanced platforms like ATAS enhance trading efficiency with order flow analysis capabilities.
Key advanced tools include:
- Customizable charting systems with multiple timeframes and up to 16 charts per tab, allowing traders to monitor various assets simultaneously.
- Over 400 built-in technical indicators plus access to 100,000+ community-created studies for in-depth market analysis.
- Real-time scanning and alert systems that notify traders of potential opportunities through mobile push notifications.
- Robust backtesting environments where traders can develop and test strategies using historical data and Monte Carlo simulations.
These tools enable traders to make informed decisions based on extensive technical analysis and real-time market data.
Frequently Asked Questions
Can I Use Multiple Stock Analysis Platforms Simultaneously for Better Results?
Using multiple stock analysis platforms simultaneously can definitely enhance investment decision-making.
Key benefits include:
- Cross-verification of data across platforms
- Access to diverse analytical tools and perspectives
- Broader market coverage and insights
However, investors should consider:
- Managing information overload
- Additional subscription costs
- Time needed to learn multiple interfaces
For ideal results, choose 2-3 complementary platforms that align with specific investment goals and integrate them systematically into the analysis workflow.
How Often Do These Platforms Update Their Financial Data and Metrics?
Financial data platforms offer various update frequencies depending on the service level and subscription type.
Most real-time platforms refresh data every second or faster, making them ideal for active traders. End-of-day services update once after market close, while fundamental metrics typically refresh quarterly with earnings reports.
Premium services often provide faster updates, while basic subscriptions may offer delayed data. Users can usually choose their preferred update frequency based on their trading needs and budget.
What Happens to My Analysis if the Software Company Goes Out Business?
If a software company ceases operations, users face several immediate challenges with their analysis work.
Historical data may become inaccessible, and real-time data feeds will likely stop functioning.
While locally stored data might remain intact, the inability to update or manipulate it through the platform creates significant limitations.
Users should regularly export their analysis and maintain backups.
Additionally, exploring alternative platforms and having a contingency plan becomes essential for business continuity.
Do These Platforms Offer Mobile Apps With Full Functionality?
Most platforms offer mobile apps with varying levels of functionality. While apps like TradingView and thinkorswim provide nearly complete desktop features, others may have limitations.
Generally available for iOS and Android, these apps prioritize essential functions like:
- Real-time price tracking
- Basic charting
- Portfolio monitoring
- News feeds
- Trade execution
Advanced analysis tools are sometimes restricted to desktop versions, but mobile apps typically sync data across devices, ensuring seamless user experience for on-the-go investors.
Are the Trading Signals and Alerts Reliable During Market Volatility?
Trading signals and alerts become less reliable during high market volatility. While these tools remain useful, their accuracy can decrease due to rapid price movements and increased market uncertainty.
Key reliability factors include:
- Signal lag time between generation and execution
- Higher false positive rates during turbulent periods
- Potential for conflicting indicators
- Price gaps affecting stop-loss orders
Traders should combine multiple indicators and implement wider stop-loss margins during volatile periods for better risk management.
Conclusion
Savvy stock market software serves as a steadfast companion for serious investors seeking success. These powerful platforms provide precise data, practical tools, and predictive analytics that help traders make more informed decisions. By carefully comparing costs, capabilities, and customization options, investors can select software that suits their specific strategy. The right analysis platform proves particularly powerful in positioning portfolios for positive performance in today’s dynamic market.


